|
|
Bollinger Bands
Bollinger Bands are a technical analysis tool invented by John Bollinger in the 1980s. Having evolved from the concept of trading bands, Bollinger Bands can be used to measure the highness or lowness of the price relative to previous trades.
Typical values for N and K are 20 and 2, respectively.
Predictive value The bands cannot, as some have supposed, be used to make reliable statements regarding what fraction of an equity's prices will lie within a certain distance of the mean value. This is because an individual equity's price does not obey known distribution functions. For example, if the bands for plus or minus two standard deviations (2SD) are computed, it is wrong to suppose that ~95% of an equity's closing prices will, on average, lie within the Bollinger bands. That would require, among other things, that the prices be normally distributed, which they are generally not. It would further require that the true standard deviation be known. The standard deviation calculated as above, however, is only an uncertain estimate of the true standard deviation. Furthermore, it should be realized that the "standard deviations" of stock prices for finite time periods are not fixed parameters as required to apply classical statistical theory, but instead are variables in constant flux depending on price volatility. The bands give a visual picture of a stock's price volatility. Nevertheless, the bands can be useful in the technical analysis of prices or returns and by Chebyshev's inequality must contain at least 75% of prices. These occurrences should be considered in relation to other factors before making investment decisions. It is of interest to note that faulty interpretation of a price touching or breaching a band based on incorrect statistical assumptions has become so widespread that some traders now use these events alone as trading signals and by so doing may have unwittingly injected significance into these band-touching events that should otherwise be absent. Nevertheless, anyone can observe over time, that for a diversified group of mutual funds, say, the proportion of daily adjusted close prices that breach their 1-month 2SD Bollinger bands varies between 5% and 15% of days, with each fund having a fairly constant, characteristic long-term breach probability descriptive of its long-term, relative volatility.
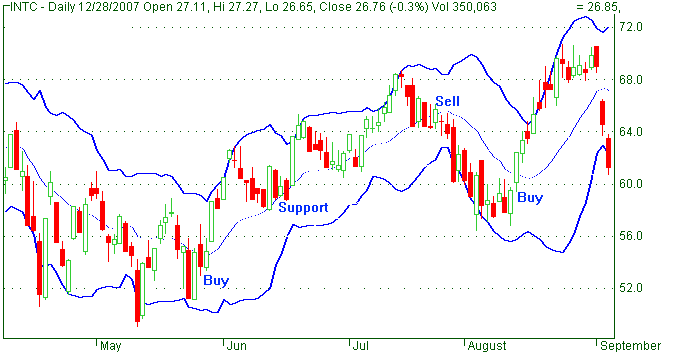
When the bands lie close together a period of low volatility in stock price is indicated. When they are far apart a period of high volatility in
price is indicated. When the bands have only a slight slope and lie approximately parallel for an extended time the price of a stock will be
found to oscillate up and down between the bands as though in a channel. Interpretation The use of Bollinger Bands varies wildly among traders. Some traders buy when price touches the lower Bollinger Band and exit when price touches the moving average in the center of the bands. Other traders buy when price breaks above the upper Bollinger Band or sell when price falls below the lower Bollinger Band. Moreover, the use of Bollinger Bands is not confined to stock traders; options traders, most notably implied volatility traders, often sell options when Bollinger Bands are historically far apart or buy options when the Bollinger Bands are historically close together, in both instances, expecting volatility to revert back towards the average historical volatility level for the stock.
|
|
|