|
|
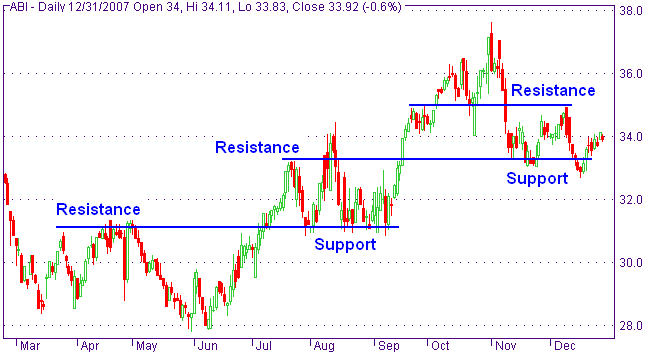
Support and
resistance
A support level is a price level where the price tends to find support as it
is going down. This means the price is more likely to "bounce" off this
level rather than break through it. However, once the price has passed this
level, even by a small amount, it is likely to continue dropping until it
finds another support level.
A
resistance level is the opposite of a support level. It is where the price
tends to find resistance as it is going up. This means the price is more
likely to "bounce" off this level rather than break through it. However,
once the price has passed this level, even by a small amount, it is likely
that it will continue rising until it finds another resistance level.
Support
and resistance levels can be identified by trend lines. Some traders believe
in using pivot point calculations.
This is an
example of support switching roles with resistance, and vice versa: When judging entry and exit investment timing using support or resistance levels it is important to choose a chart based on a price interval period that aligns with your trading strategy timeframe. Short term traders tend to use charts based on interval periods, such as 1 minute (i.e. the price of the security is plotted on the chart every 1 minute), with longer term traders using price charts based on hourly, daily, weekly or monthly interval periods. Typically traders use shorter term interval charts when making a final decisions on when to invest, such as the following example based on 1 week of historical data with price plotted every 15 minutes. In this example the early signs that the stock was coming out of a downtrend was when it started to form support at $30.48 and then started to form higher highs and higher lows signaling a change from negative to positive trending.
|
|
|