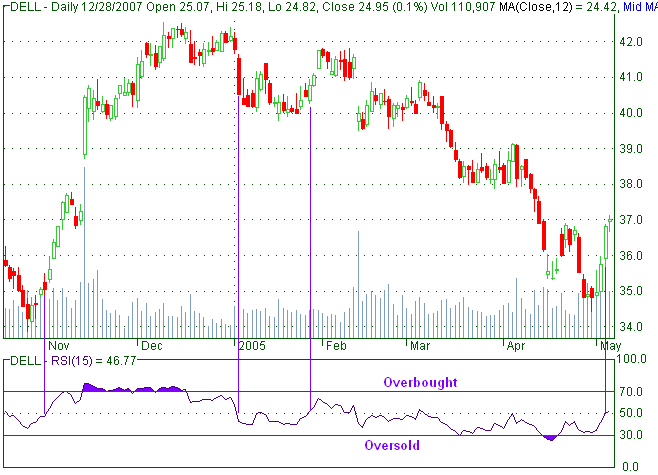
Foxchart: Better Stock Charts

Symbol:

Chart School Android

Relative strength index

The Relative Strength Index (RSI) is a financial technical analysis oscillator showing price strength by comparing upward and downward close-to-close movements.

The RSI is popular because it is relatively easy to interpret. It was developed by J. Welles Wilder and published in Commodities magazine (now called Futures magazine) in June 1978, and in his New Concepts in Technical Trading Systems the same year.

Calculation

    RSI = 100 - 100 / (1 + RS)

    RS = Average Gain / Average Loss

   Average Gain = [(previous Average Gain) x 13 + current Gain] / 14
   First Average Gain = Total of Gains during past 14 periods / 14

   Average Loss = [(previous Average Loss) x 13 + current Loss] / 14
   First Average Loss = Total of Losses during past 14 periods / 14

   Note: "Losses" are reported as positive values.

How To Use

Overbought/Oversold
Using 70 and 30 as overbought and oversold levels respectively. Generally, if the RSI rises above 30 it is considered bullish for the underlying stock. Conversely, if the RSI falls below 70, it is a bearish signal.

  Go long when RSI falls below the 30 level and rises back above it

  Go short when RSI rises above the 70 level and falls back below it

Divergences

Buy and sell signals can also be generated by looking for positive and negative divergences between the RSI and the underlying stock. For example, consider a falling stock whose RSI rises from a low point back up to a high point. Because of how the RSI is calculated, the underlying stock will often reverse its direction soon after such a divergence. As in that example, divergences that occur after an overbought or oversold reading usually provide more reliable signals.

   Go long on a positive divergence where the first trough is below 30.
  Go short on a negative divergence where the first peak is above 70.

Centerline Crossover

The centerline for RSI is 50. Readings above and below can give the indicator a bullish or bearish tilt. On the whole, a reading above 50 indicates that average gains are higher than average losses and a reading below 50 indicates that losses are winning the battle. Some traders look for a move above 50 to confirm bullish signals or a move below 50 to confirm bearish signals.

Accumulation Distribution

Bollinger Bands

Commodity Channel Index

Momentum

Money Flow

Moving Average

On Balance Volume

Parabolic SAR

Relative Strength Index

Stochastic oscillator

Support and Resistance

The Elliott wave principle

Trend Lines

Triple Exponential Average

Volume At Price

Data and information is provided for informational purposes only, and is not intended for trading purposes. Neither Foxchart.com. nor its data provider shall be liable for any errors or delays in the content, or for any actions taken in reliance thereon. By accessing the Foxchart.com web site, a user agrees not to redistribute the information found therein. © Copyright 2007 - 2017 Foxchart.com. All rights reserved.