|
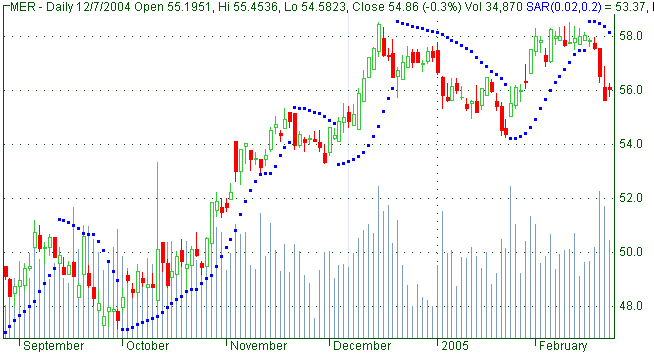
Parabolic SAR
Parabolic SAR (SAR - stop and reverse) is a method devised by J. Welles
Wilder, Jr, to find trends in market prices or securities. It may be used as
a trailing stop loss based on prices tending to stay within a parabolic
curve during a strong trend.
The concept draws on the idea that time is an enemy, and unless a security
can continue to generate more profits over time, it should be liquidated.
The indicator generally works well in trending markets, but provides
"whipsaws" during non-trending, sideways phases. A parabola below the price
is generally bullish, while a parabola above is generally bearish.
Calculation
The Parabolic SAR is calculated almost independently for each trend in the
price. When the price is in an uptrend, the SAR appears below the price and
converges upwards towards it. Similarly, on a downtrend, the SAR appears
above the price and converges downwards.
At each step within a trend, the SAR is calculated ahead of time. That is,
tomorrow's SAR value is built using data available today. The general
formula used for this is:
SAR(n+1) = SAR(n) + α x (EP - SAR(n))
Where SAR(n) and SAR(n+1) represent today's and tomorrow's SAR values,
respectively.
The extreme point, EP, is a record kept during each trend that represents
the highest value reached by the price during the current uptrend — or
lowest value during a downtrend. On each period, if a new maximum (or
minimum) is observed, the EP is updated with that value.
The α value represents the acceleration factor. Usually, this is set to a
value of 0.02 initially. This factor is increased by 0.02 each time a new EP
is recorded. In other words, each time a new EP is observed, it will
increase the acceleration factor. This will then quicken the rate at which
the SAR converges towards the price. To keep it from getting too large, a
maximum value for the acceleration factor is normally set at 0.20, so that
it never goes beyond that.
The SAR is recursively calculated in this manner for each new period. There
are, however, two special cases that will modify the SAR value:
-
If
tomorrow's SAR value lies within (or beyond) today's or yesterday's price
range, the SAR must be set to the closest price bound. For example, if in
an uptrend, the new SAR value is calculated and it results to be greater
than today's or yesterday's lowest price, the SAR must be set equal to
that lower boundary.
-
If
tomorrow's SAR value lies within (or beyond) tomorrow's price range, a new
trend direction is then signaled, and the SAR must "switch sides."
Upon a trend switch, several things happen. The first SAR value for this
new trend is set to the last EP recorded on the previous trend. The EP is
then reset accordingly to this period's maximum. The acceleration factor
is reset to its initial value of 0.02.
Trading Signals
1). To confirm that the market is
trending:
Use a trend
indicator, or Stop trading with the Parabolic SAR if whipsawed twice
in a row and re-commence after a breakout from the chart pattern.
2). A trade is signaled when the
price bars and stop levels intersect:
Go long when price meets the Parabolic SAR stop level,
while short.
Go short when price meets the Parabolic SAR stop level,
while long.
|
Accumulation Distribution
Bollinger Bands
Commodity Channel Index
Momentum
Money Flow
Moving Average
On Balance Volume
Parabolic SAR
Relative Strength Index
Stochastic oscillator
Support and Resistance
The Elliott wave principle
Trend Lines
Triple Exponential Average
Volume At Price
|