|
Triple
Exponential Average (Trix)
Trix (or Triple Exponential Average) is a technical analysis oscillator developed in the 1980s by
Jack Hutson, editor of Technical Analysis of Stocks and Commodities
magazine. It shows the slope (ie. derivative) of a triple-smoothed
exponential moving average. The name Trix is from "triple exponential."
Calculation
Trix is
calculated with a given N-day period as follows:
Smooth prices (often closing prices) using an N-day exponential moving
average (EMA).
Smooth that series using another N-day EMA.
Smooth a third time, using a further N-day EMA.
Calculate the percentage difference between today's and yesterday's value in
that final smoothed series.
How To
Use
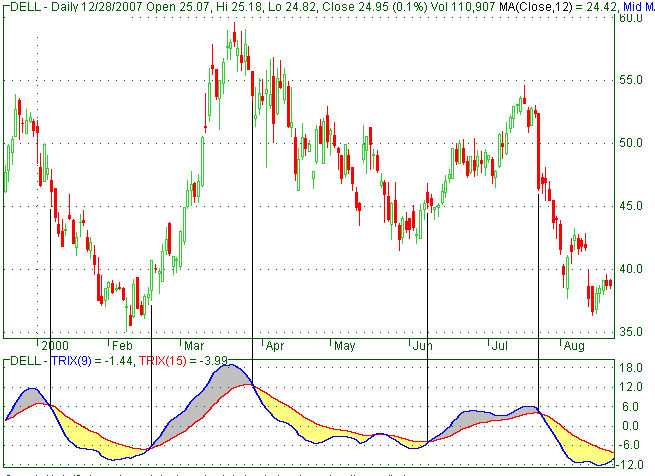
Like any moving average, the triple EMA is just a smoothing of price data
and therefore is trend-following. A rising or falling line is an uptrend or
downtrend and Trix shows the slope of that line, so it's positive for a
steady uptrend, negative for a downtrend, and a crossing through zero is a
trend-change, ie. a peak or trough in the underlying average.
The triple-smoothed EMA is very different from a plain EMA. In a
plain EMA the latest few days dominate and the EMA follows recent prices
quite closely; however, applying it three times results in weightings spread
much more broadly, and the weights for the latest few days are in fact
smaller than those of days further past. The following graph shows the
weightings for an N=10 triple EMA (most recent days at the left):
Triple exponential moving average weightings, N=10 (percentage versus days
ago)
The easiest way to calculate the triple EMA based on successive values is
just to apply the EMA three times, creating single-, then double-, then
triple-smoothed series. The triple EMA can also be expressed directly in
terms of the prices as below, with p0 today's close, p1 yesterday's, etc,
and with (as for a plain EMA):
The coefficients are the triangle numbers, n(n+1)/2. In theory, the sum is
infinite, using all past data, but as f is less than 1 the powers fn become
smaller as the series progresses, and they decrease faster than the
coefficients increase, so beyond a certain point the terms are negligible.
|
Accumulation Distribution
Bollinger Bands
Commodity Channel Index
Momentum
Money Flow
Moving Average
On Balance Volume
Parabolic SAR
Relative Strength Index
Stochastic oscillator
Support and Resistance
The Elliott wave principle
Trend Lines
Triple Exponential Average
Volume At Price
|