|
On-balance volume
On-balance volume (OBV) is a technical analysis indicator intended to
relate price and volume in the stock market. OBV is based on a cumulative
total volume. Volume on an up day (close higher than previous close) is
added and volume on a down day is subtracted.
The technique was investigated in the 1940s
by Woods and Vignolia and presented in a course by them in 1946. They called
it "cumulative volume". Joseph Granville gave it the name "on-balance
volume" and popularized the technique in his 1963 book Granville's New Key
to Stock Market Profits. It can be applied to stocks individually based upon
their daily up or down close, or the market as a whole using breadth of
market data, i.e. the advance/decline ratio.
Calculation
As stated above, OBV is calculated by adding
the day's volume to a running cumulative total when the security's price
closes up, and subtracts the volume when it closes down.
For example, if today the closing price is greater than yesterday's closing
price, then the new
OBV = Yesterday's OBV + Today's Volume
If today the closing price is less than yesterday's closing price, then the
new
OBV = Yesterday's OBV - Today's Volume
If today the closing price is equal to yesterday's closing price, then the
new
OBV = Yesterday's OBV
The starting point for an OBV total, ie. the zero point, is arbitrary. Only
the shape of the resulting indicator is used, not the actual level of the
total.
How To Use
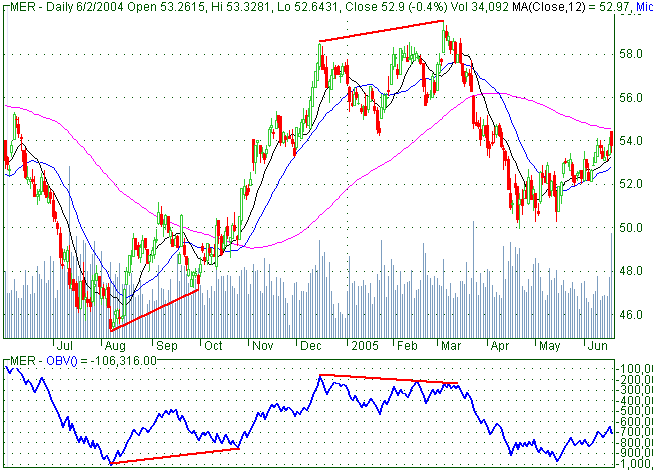
OBV is generally used to confirm price moves. The idea is that volume is
higher on days where the price move is in the dominant direction, for
example in a strong uptrend more volume on up days than down days.
So when prices are going up, OBV should be going up too, and when prices
make a new rally high, OBV should too. If OBV fails to go past its previous
rally high then this is a negative divergence, suggesting a weak move.
|
Accumulation Distribution
Bollinger Bands
Commodity Channel Index
Momentum
Money Flow
Moving Average
On Balance Volume
Parabolic SAR
Relative Strength Index
Stochastic oscillator
Support and Resistance
The Elliott wave principle
Trend Lines
Triple Exponential Average
Volume At Price
|