Foxchart: Better Stock Charts

Symbol:

Chart School Android

Commodity Channel Index

The Commodity Channel Index (CCI) is an oscillator originally introduced by Donald Lambert in an article published in the October 1980 issue of Commodities magazine (now known as Futures magazine).

Since its introduction, the indicator has grown in popularity and is now a very common tool for traders in identifying cyclical trends not only in commodities, but also equities and currencies. The CCI can be adjusted to the timeframe of the market traded on by changing the averaging period.

Calculation 

The CCI is calculated as the difference between the typical price of a commodity and its simple moving average, divided by the mean deviation of the typical price. The index is usually scaled by a factor of 1/0.015 to provide more readable numbers:

There are 4 steps involved in the calculation of the CCI:

  1. Calculate the last period's Typical Price (TP) = (H+L+C)/3 where H = high, L = low, and C = close.

  2. Calculate the 20-period Simple Moving Average of the Typical Price (SMATP).

  3. Calculate the Mean Deviation. First, calculate the absolute value of the difference between the last period's SMATP and the typical price for each of the past 20 periods. Add all of these absolute values together and divide by 20 to find the Mean Deviation.

  4. The final step is to apply the Typical Price (TP), the Simple Moving Average of the Typical Price (SMATP), the Mean Deviation and a Constant (.015) to the following formula:

   CCI = ( Typical Price - SMATP ) / ( .015 X Mean Deviation )

Interpretation

The Commodity Channel Index is often used for detecting divergences from price trends as an overbought/oversold indicator, and to draw patterns on it and trade according to those patterns. In this respect, it is similar to bollinger bands, but is presented as an indicator rather than as overbought/oversold levels.

The CCI typically oscillates above and below a zero line. Normal oscillations will occur within the range of +100 and -100. Readings above +100 imply an overbought condition, while readings below -100 imply an oversold condition. As with other overbought/oversold indicators, this means that there is a large probability that the price will correct to more representative levels.

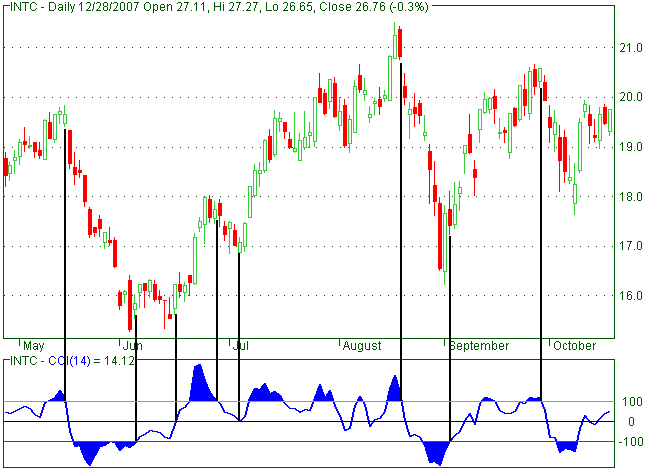
How to use CCI

Buy or sell signals happen 20 - 30 % of the time while from 70 up to 80 % of time Commodity Channel Index's value is fluctuating between +100 and -100. It's supposed that if CCI overcomes the level of +100 from below upwards, it means that the currency pair is moving in the direction of the strong ascending trend, thus there is a clear purchase signal. And once CCI goes under +100 the position is supposed to be closed on a return signal. At the same time, it's considered that if Commodity Channel Index moves to -100 point from top to down, it means that the currency pair is meeting a strong descending trend, and there's a sale signal. As soon as CCI again crosses the level of -100 this position is considered closed.

One can treat break of trend lines formed on the indicator as input or output signals from a position. At overbought - above +100 - the break of the trend line downwards is supposed a sale signal and at an oversold level - below-100 - the break of the trend line upwards is supposed a signal to growth of the market. Thus these lines are also based on the connection of consecutive maxima or minima.

Accumulation Distribution

Bollinger Bands

Commodity Channel Index

Momentum

Money Flow

Moving Average

On Balance Volume

Parabolic SAR

Relative Strength Index

Stochastic oscillator

Support and Resistance

The Elliott wave principle

Trend Lines

Triple Exponential Average

Volume At Price

Data and information is provided for informational purposes only, and is not intended for trading purposes. Neither Foxchart.com. nor its data provider shall be liable for any errors or delays in the content, or for any actions taken in reliance thereon. By accessing the Foxchart.com web site, a user agrees not to redistribute the information found therein. © Copyright 2007 - 2017 Foxchart.com. All rights reserved.